Features
Part of How to read an annual trend report in about twenty minutes
Trend reports across platforms: six places where measurement diverges
Annual trend reports platforms and the six places measurement tools diverge: why the sample is the deep problem, and what to check before quoting a figure.
Two trend tools looking at the same subject in the same month will usually disagree, sometimes about the direction. People treat that as a scandal or as a reason to pick a favorite. It is neither.
The tools measure different populations with different instruments over different windows, so disagreement is the expected result and agreement is the outcome that would need explaining. This page sets out where the differences come from, so you can tell a real conflict from two correct answers to two different questions.
What to take away
- No trend tool measures everyone. Each one observes whatever population it can reach, and that population is a commercial and technical choice.
- Six design decisions account for nearly all disagreement between tools, and every one of them belongs in a methods note.
- If a report has no methods note, it is marketing. Read it as marketing.
The six places tools diverge
- What is counted. Queries, posts, mentions, impressions, panel-reported behavior and passively collected browsing are six different quantities. A rise in one is not a rise in another, and none of them is "interest".
- Who is in the sample. This is the biggest single source of difference and the least discussed.
- The window and the granularity. A daily series and a weekly series of the same underlying data peak on different dates and have different maxima.
- Normalisation. Raw counts, share of category, per-head figures and indexed series answer different questions, and only one of them is comparable across terms.
- Cleaning. Deduplication rules, bot filtering and spam thresholds vary enormously, and tightening a bot filter can produce a fall that looks like a change in behavior.
- Revision policy. Some tools restate history when they improve a model. If you quoted a figure last quarter, check whether the same query still returns it. Marking a restatement instead of overwriting it is part of the maintenance a report needs after publication.
Why the sample is the deep problem
Every tool has a sampling frame: the set of people or items it could possibly observe. A tool built on one product's own traffic has that product's users as its frame. A tool built on an opt-in panel has people willing to install a measurement app. A tool built on public posts has people who post publicly.
None of these frames is the general population, and the gap cannot be closed by arithmetic. Weighting adjusts for known differences between the sample and the target, which helps when the difference is in a variable you measured and does nothing when it is in the reason people joined the panel in the first place.
That is the standing limitation of non-probability sampling, and it applies to almost every commercial trend product, because probability samples at this scale are prohibitively expensive.
The practical consequence is modest and specific. Use these tools for relative movement inside their own frame, where the frame is at least consistent month to month. Do not use them for absolute levels or to make claims about people the frame excludes.
Reading a rise as a fact about the world rather than about the frame is the error taken apart in worked cases of misread spikes.
What to check before quoting anything
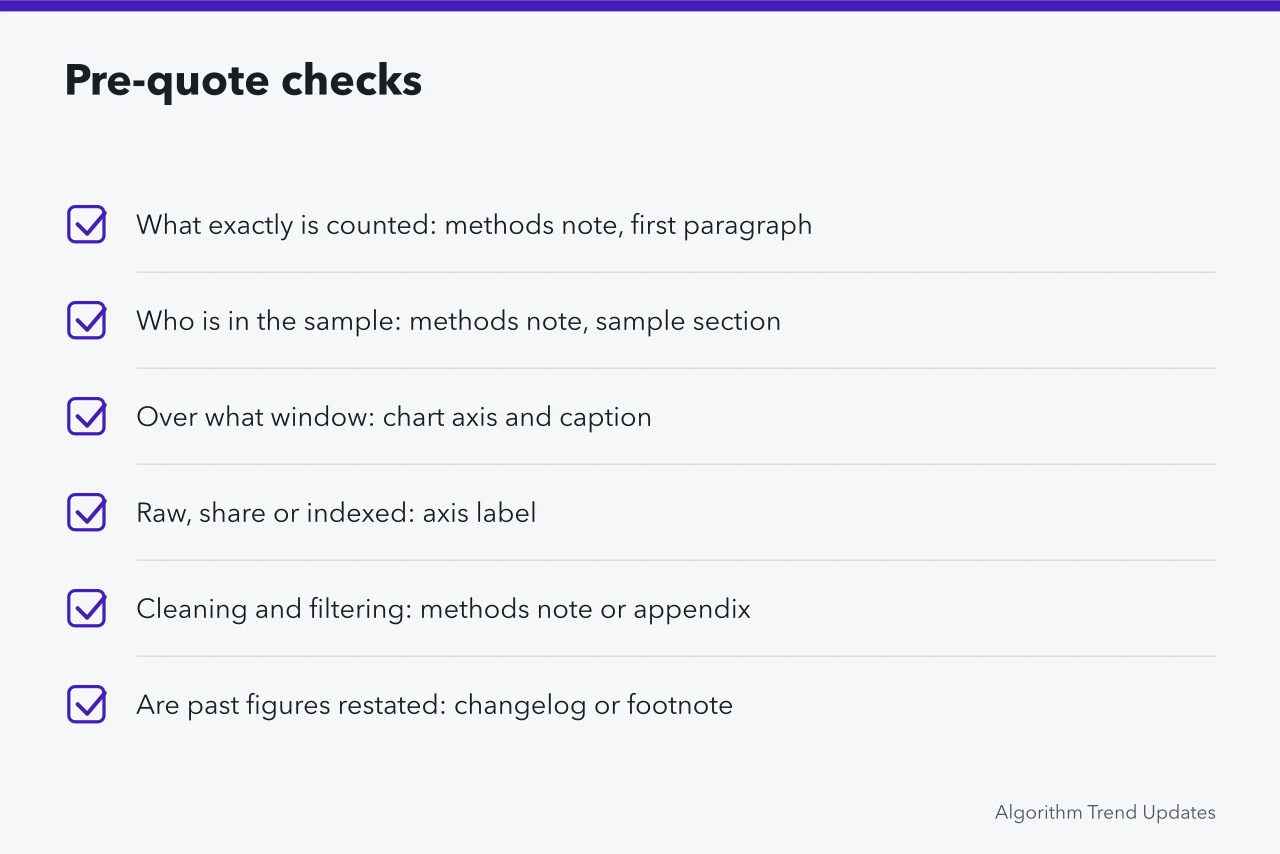
| Question | Where to look | A bad answer |
|---|---|---|
| What exactly is counted | Methods note, first paragraph | A word like activity with no definition |
| Who is in the sample | Methods note, sample section | A large number of respondents and no description of them |
| Over what window | Chart axis and caption | A period that ends conveniently at a peak |
| Raw, share or indexed | Axis label | A y-axis with no units at all |
| Cleaning and filtering | Methods note or appendix | No mention of bots in a dataset that obviously contains them |
| Are past figures restated | Changelog or footnote | Silence, in a product that has clearly improved its model |
The rule that follows is simple to state and unpopular to apply: if you cannot answer the first two rows, do not quote the number. Not in a deck, a post, or as background.
A figure whose population is unknown is not a weak fact, it is not a fact. The same test decides which sources deserve weight on a fast-moving subject: the comparison discipline used for other kinds of source.
What to do when two tools disagree
Do not average them. Averaging two measurements of different things produces a measurement of nothing, and it destroys the one piece of information the disagreement was giving you, which is that at least one of your assumptions about the subject is wrong.
Instead, find the axis they differ on: nine times out of ten it is population or window. Once you know which, both readings usually become sensible.
A tool observing a younger frame shows a shift earlier, while a tool with a weekly window smooths away a two-day event that a daily tool reports as the story of the month.
Then decide which frame matches your question. If your customers look like the panel, that tool is more relevant to you regardless of which one is larger. Relevance beats sample size for a decision about a specific audience. Where the disagreement is about availability rather than measurement, the comparison of status sources covers the parallel case.
Common questions
Is a bigger sample always better?
No. A large sample of the wrong population is more confidently wrong than a small one. Size reduces random error and does nothing at all about a biased frame.
Can I use a free tool for serious work?
For relative movement within its own frame, often yes. For anything requiring an absolute level or a claim about a general population, no, and this is not a price problem. The paid tools have the same limitation and better documentation of it.
Why do some reports refuse to give absolute numbers?
Sometimes commercial sensitivity, sometimes because they genuinely cannot support them. An indexed series is the honest output of a tool that knows its frame is not representative, so treat the refusal as information about the method rather than as evasion.
How often should I re-check a figure I am relying on?
Whenever the tool announces a method change, and otherwise once a year. Restatements are common and quiet, and a number that has been sitting in a deck for eighteen months is usually no longer the number the tool would give you today. The overview of annual trend reports covers the wider reading discipline.